SCOT has evolved from a classic data sharing platform to a powerful supply chain optimisation tool. One of the new features with major impact is Forecast Sharing.
Forecast Sharing provides transparency between you and your suppliers, allowing them to better predict your upcoming orders and thus ensures more seamless operations. Knowing in advance about possible order volumes allows your suppliers to better prepare and keeps Metro stocks at the needed levels.
This article will guide you through the Forecast Sharing page which is available in SCOT for both Metro and your Suppliers.
What is Forecast Sharing
Traditionally, data flows into SCOT from backend (MDSP*), which automatically analyses all METRO sales data - including sales (projected/predicted sales to end consumers) and orders (planned to be placed by admins to suppliers).
The forecast data is available from the current week (available every Tuesday) plus the 12 following weeks. So there is visibility for a total period of 13 weeks ahead.
*NOTE: Data is coming from MDSP to EDGE once a week. Every Tuesday morning, new data exported from MDSP on the Sunday before becomes available in SCOT. The data contains up to 13-week information, Order Forecast (OF), Sales Forecast (SF), Sales Forecast Base (SFB), Sales Forecast Promo (SFP), aggregated at week-level for each supplier account (supplier number).
You can select the account(s)/supplier number(s) and also fill in the remaining filters - Week Number, Portfolio, Article Variant No - Name, Subsys Number, Supplier Article Number, GTIN, Category (the highest level of article grouping in the sourcing system).
Once the required filters are selected, click on Search.
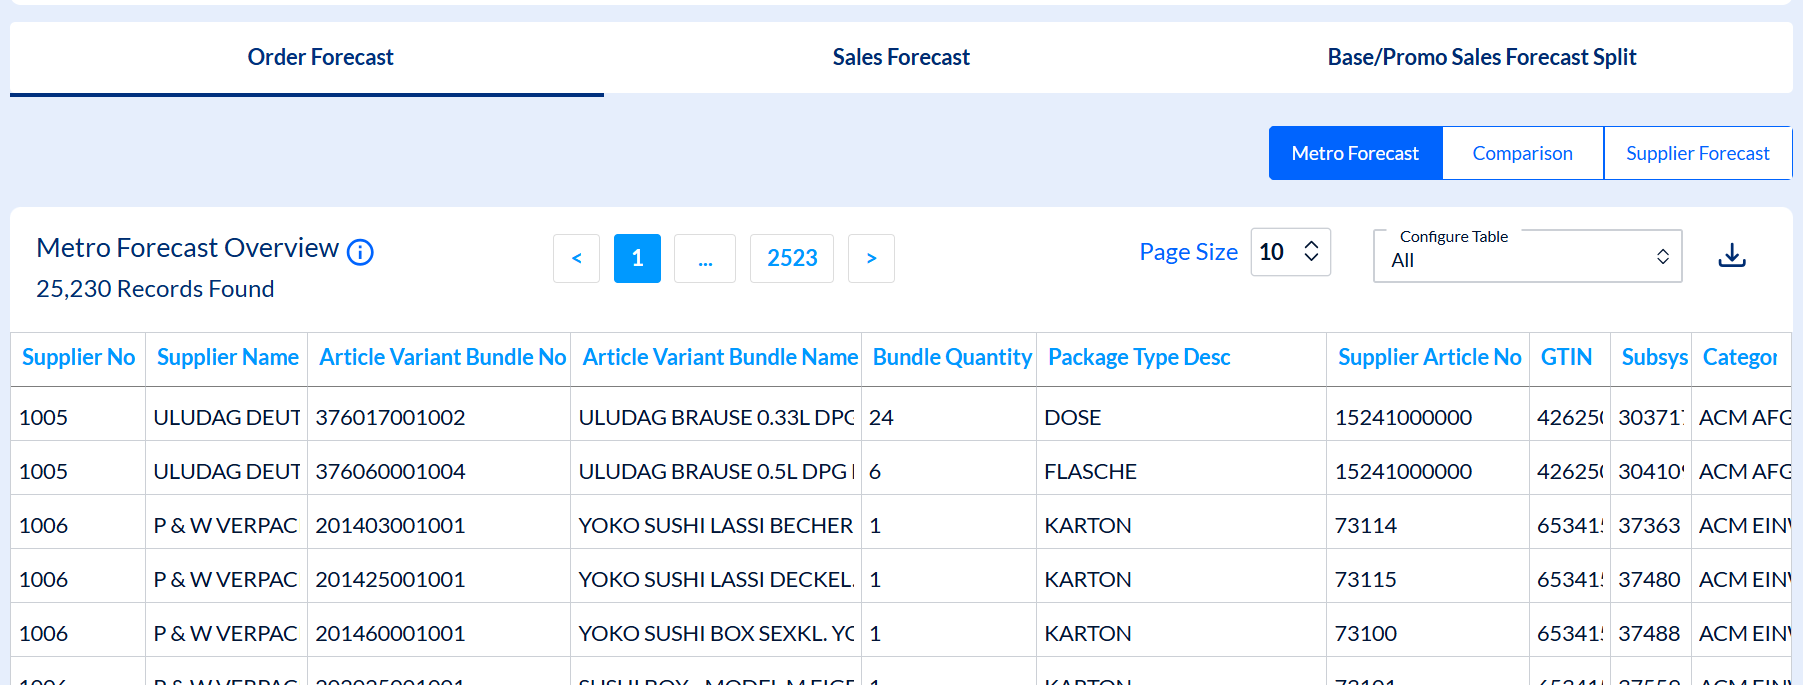
The results table shows all the units in buying bundle quantities.
The Forecast Sharing data is divided into three sections:
- Order Forecast - shows information related to Metro order plan
- Sales Forecast - shows Metro's expectations in terms of store sales
- Base/Promo SalesForecast Split - shows separately Base Sales Forecast (expected sales during regular periods, without special activities) and Promo Sales Forecast (expected sales during promotional period)
IMPORTANT! Suppliers have visibility over Forecast Data depending on the Access rights you have granted to them in the Access Management section of SCOT.
Order Forecast & Forecast Exchange
We will focus on the Order Forecast because it provides a special feature: Forecast Exchange. This allows suppliers to also enter their own Forecast and share it with you. This means that in Order Forecast you will have visibility over:
- Metro Forecast - your own Metro forecast of orders
- Supplier Forecast - your supplier's feedback on that forecast - will they be able to match your demand and how their deliveries are expected to look like in terms of quantity
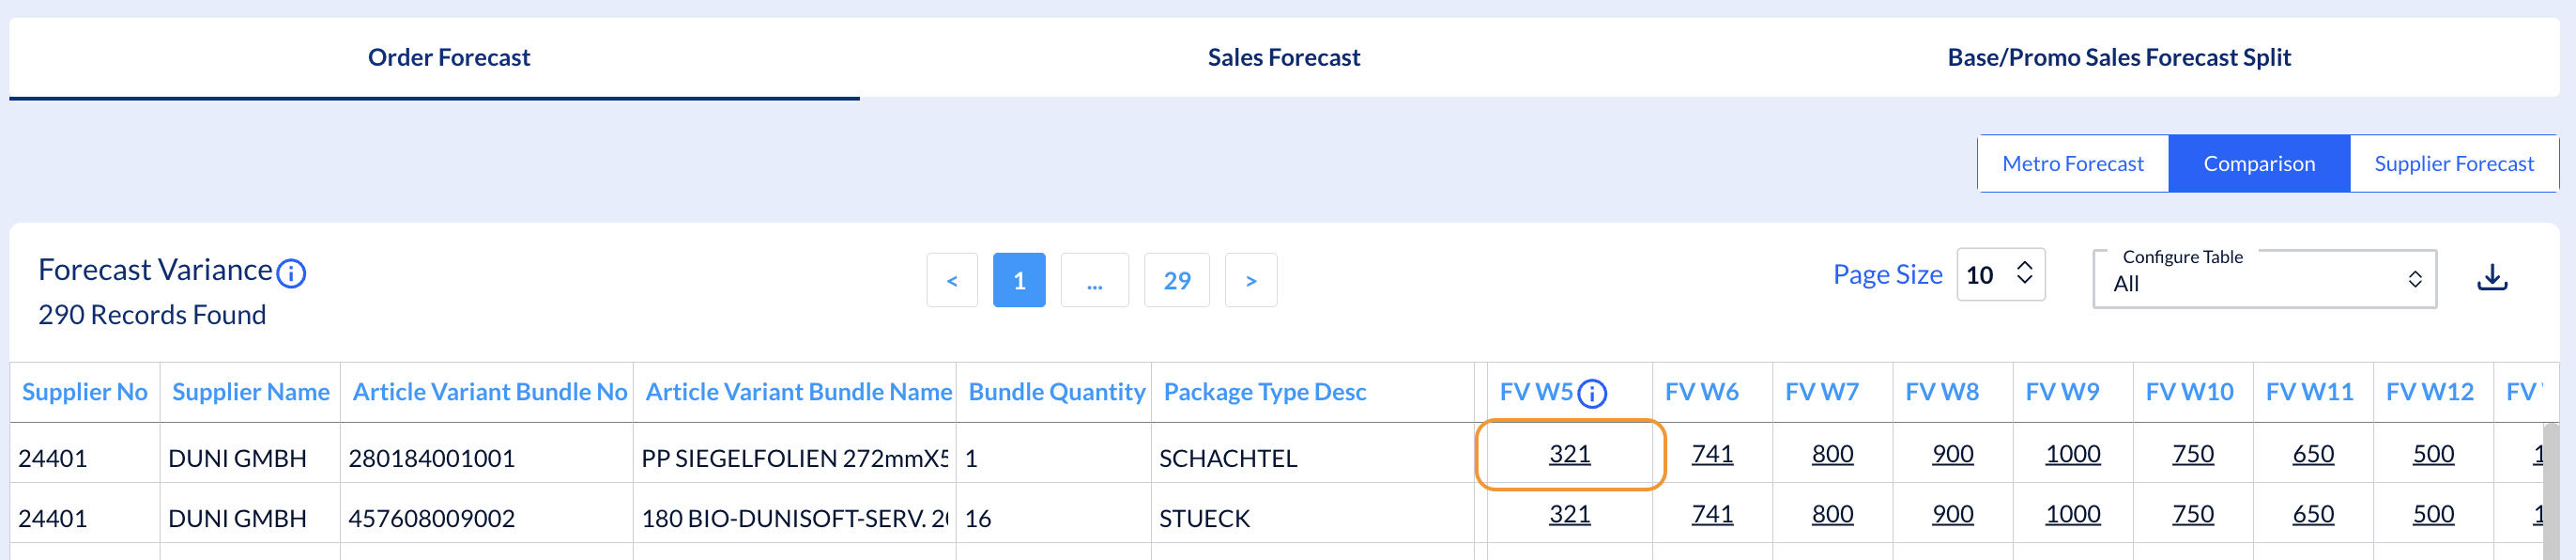
- Comparison - a comparison between your forecast and the supplier's - Forecast Variance - allowing you to quickly assess the projected deliveries for the next 13 weeks
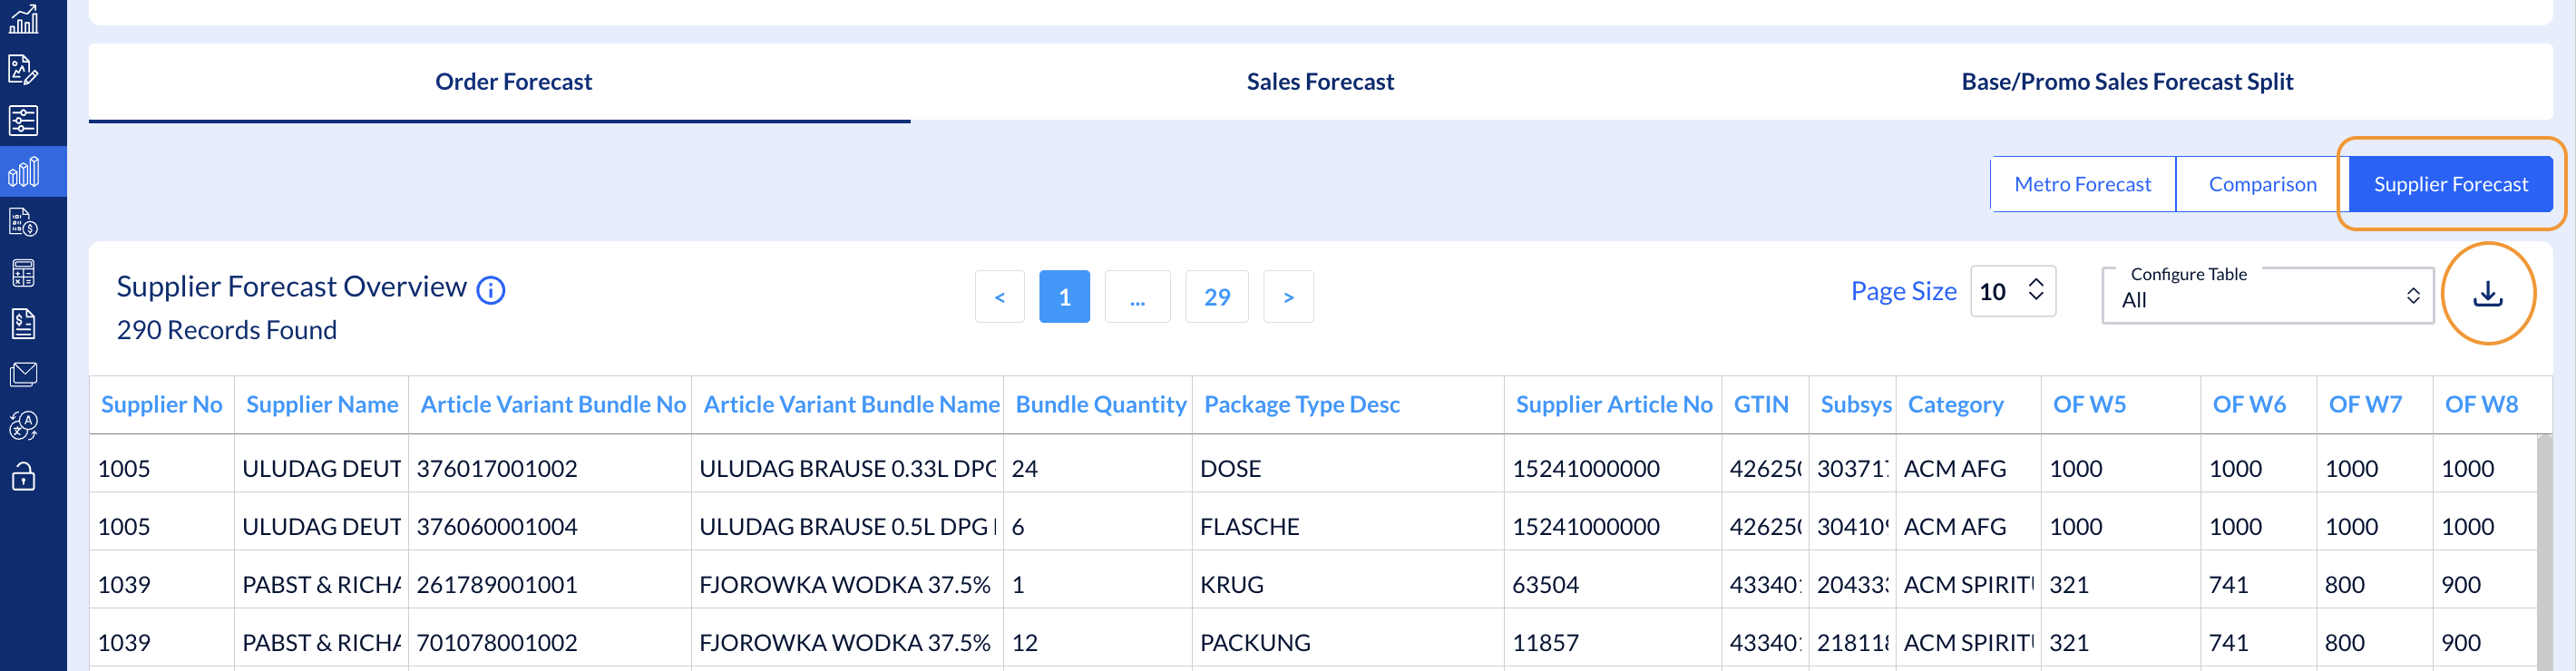
By clicking on Supplier Forecast, you can see a grid with data similar to Metro Forecast grid.
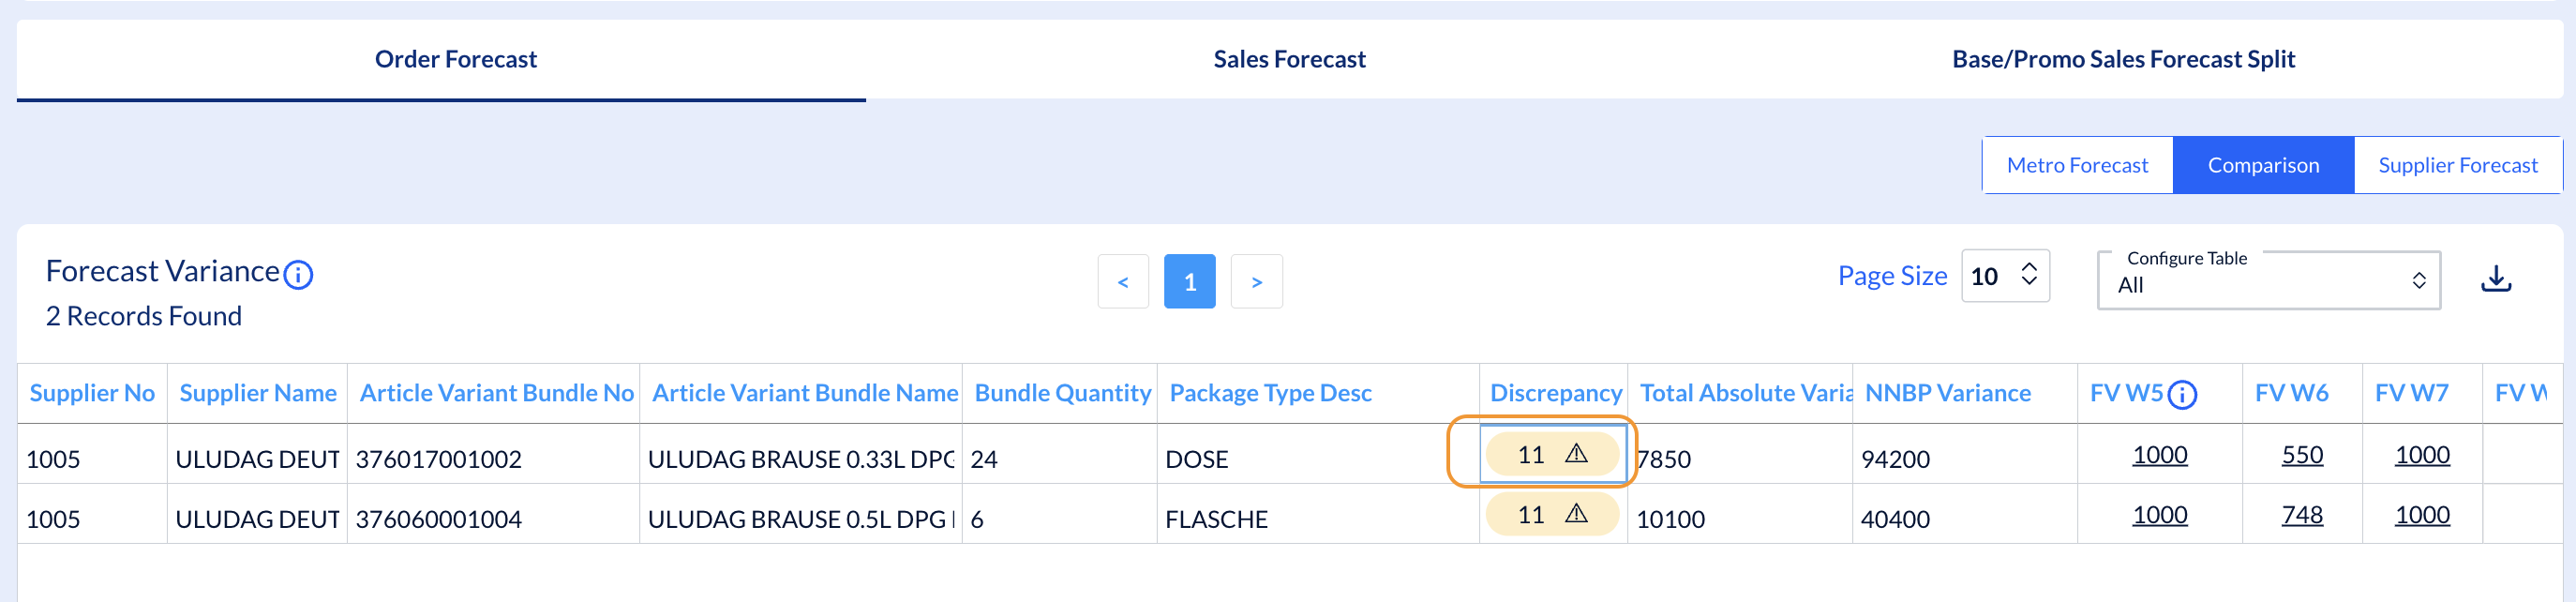
By clicking on Comparison, you can check the Forecast Variance at article level. You have two ways to do that:
1. for the entire forecasted period (13 weeks)
For a specific article, click on the warning cell in the Discrepancy column.
NOTE: The number shown in the cell of Discrepancy column (e.g. "11" below) reflects the number of weeks with forecast variance - excluding the weeks where discrepancies are 0 (zero) or the cells are empty (no forecast added).
A Discrepancy Summary window pops up, showing you data for all weeks with forecast discrepancies.
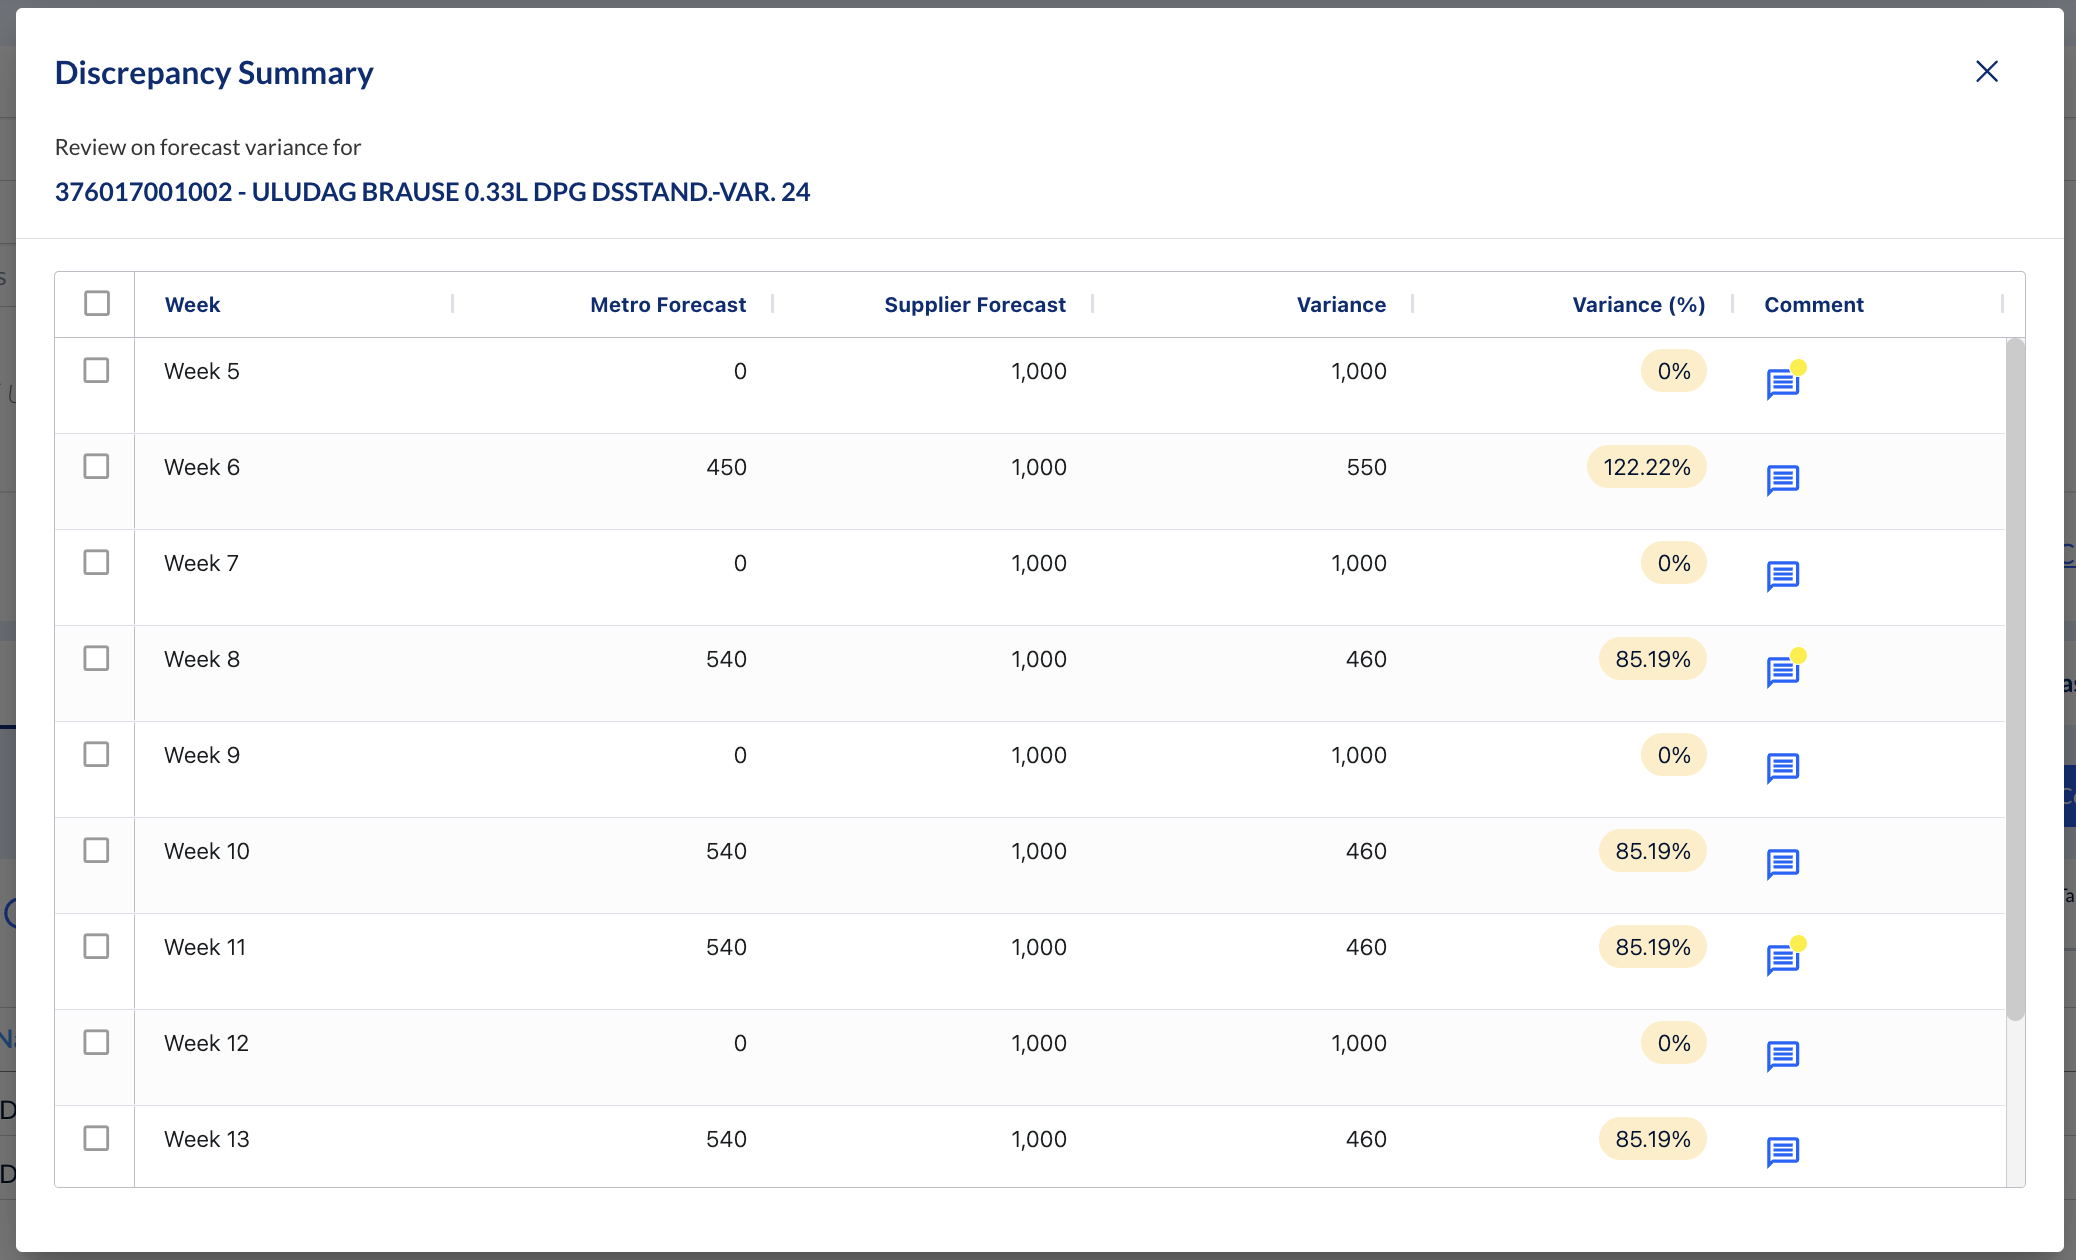
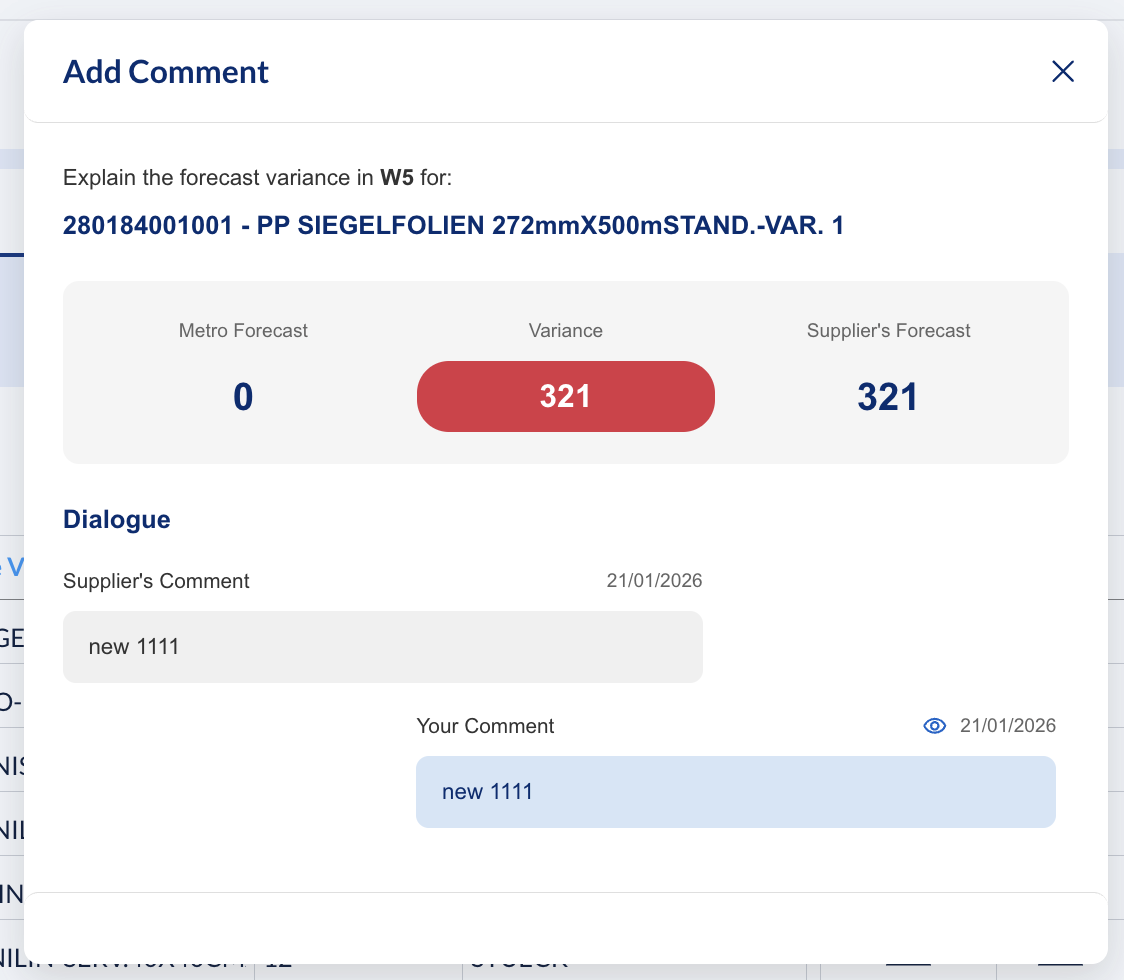
NOTE: When Metro Forecast = 0 (zero), it means no order is planned for that week. But if Supplier Forecast is > 0 (zero), then the variance in percentage is calculated as 0 (zero).
E.g. Metro Forecast = 0, but Supplier Forecast = 100. Variance as a quantity is 100. Variance as a percentage is 0%.
Variance is 0 when Metro Forecast = Supplier Forecast (either same values or both 0).
2. for one week only
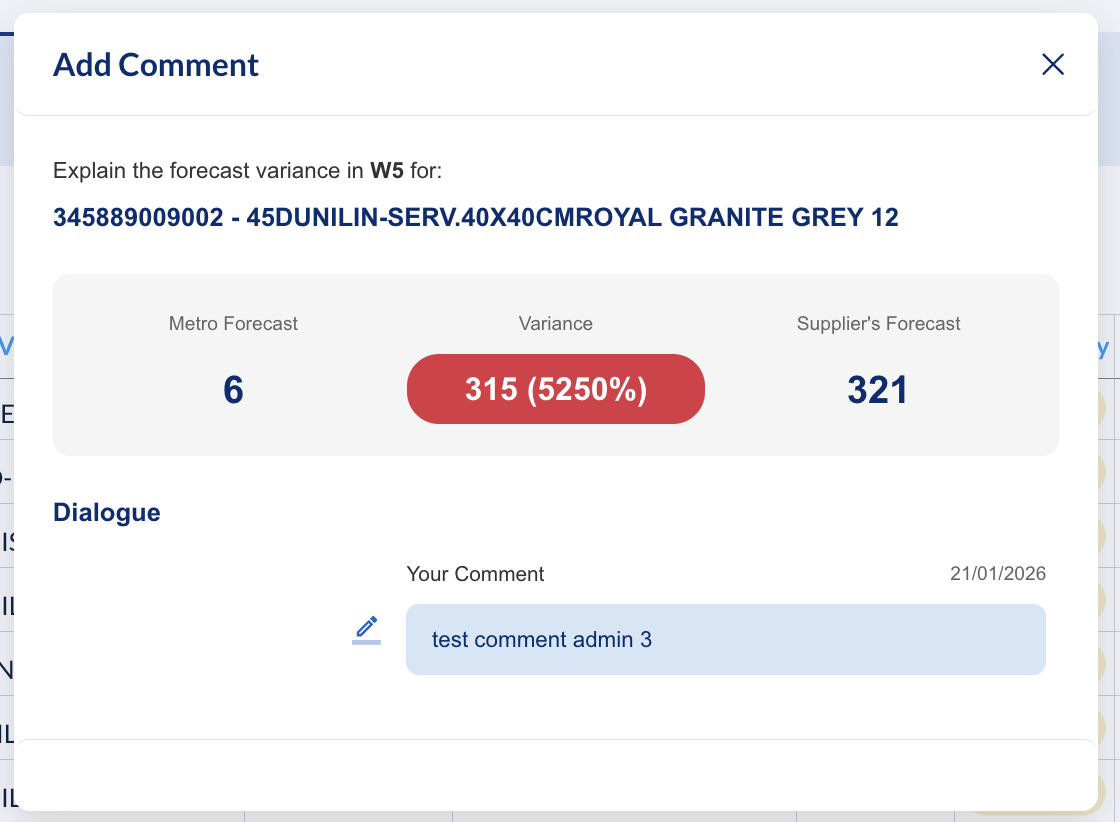
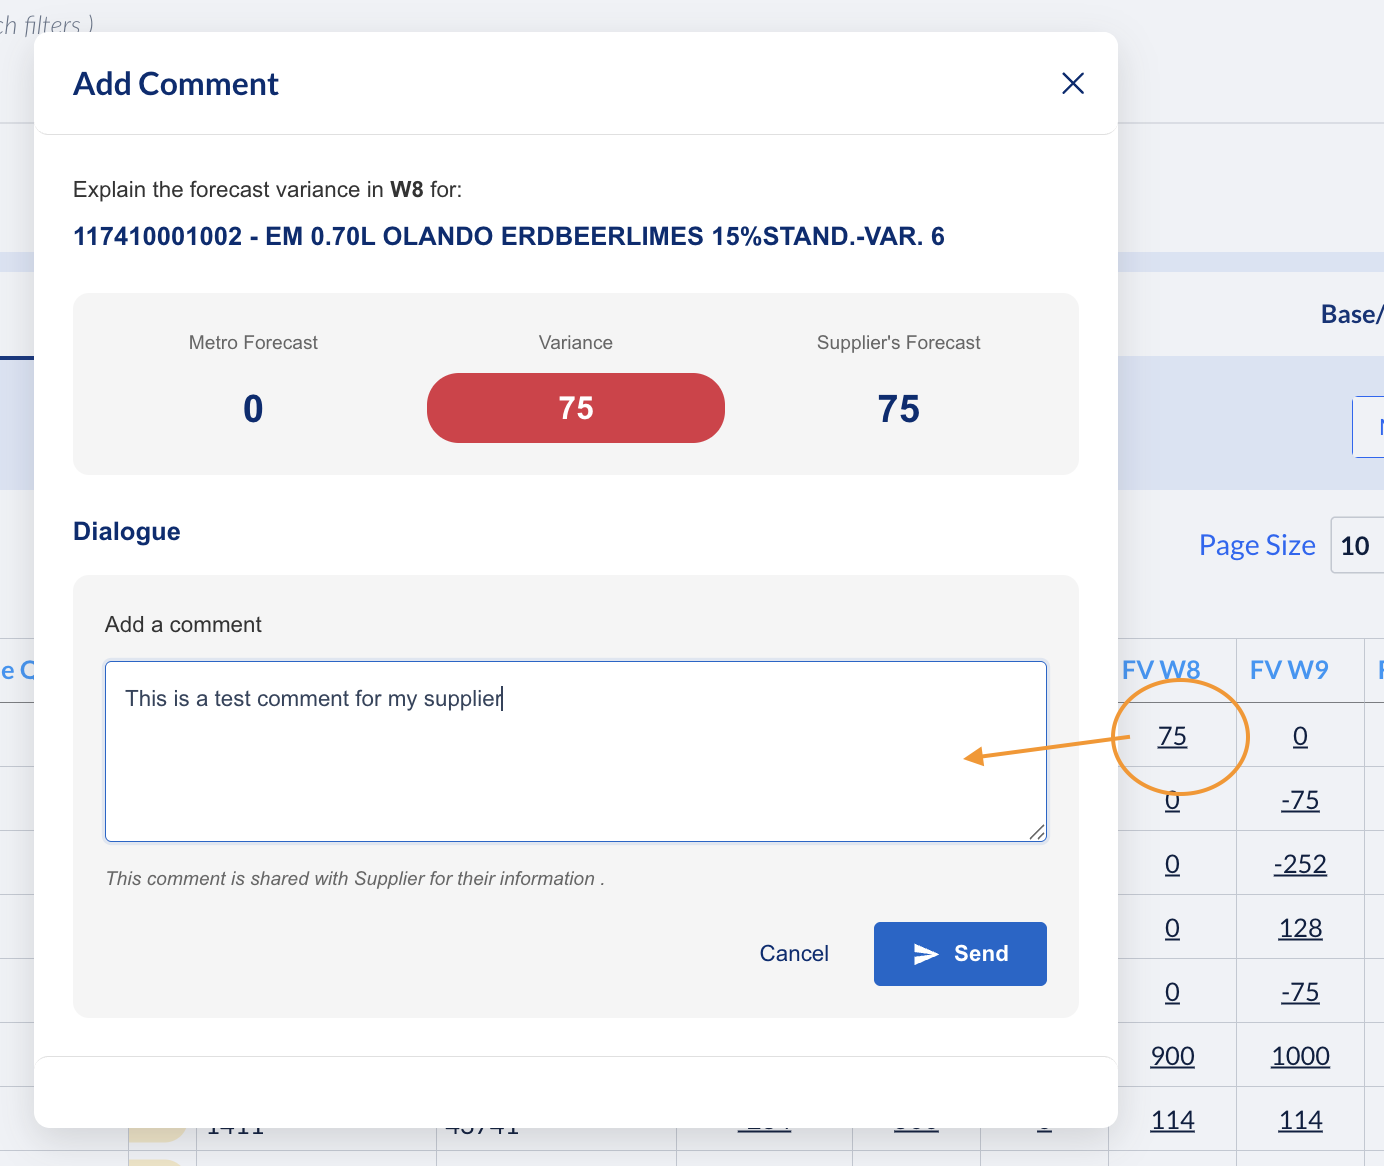
For a specific article, click on the Forecast Variance number for a particular week in the grid.
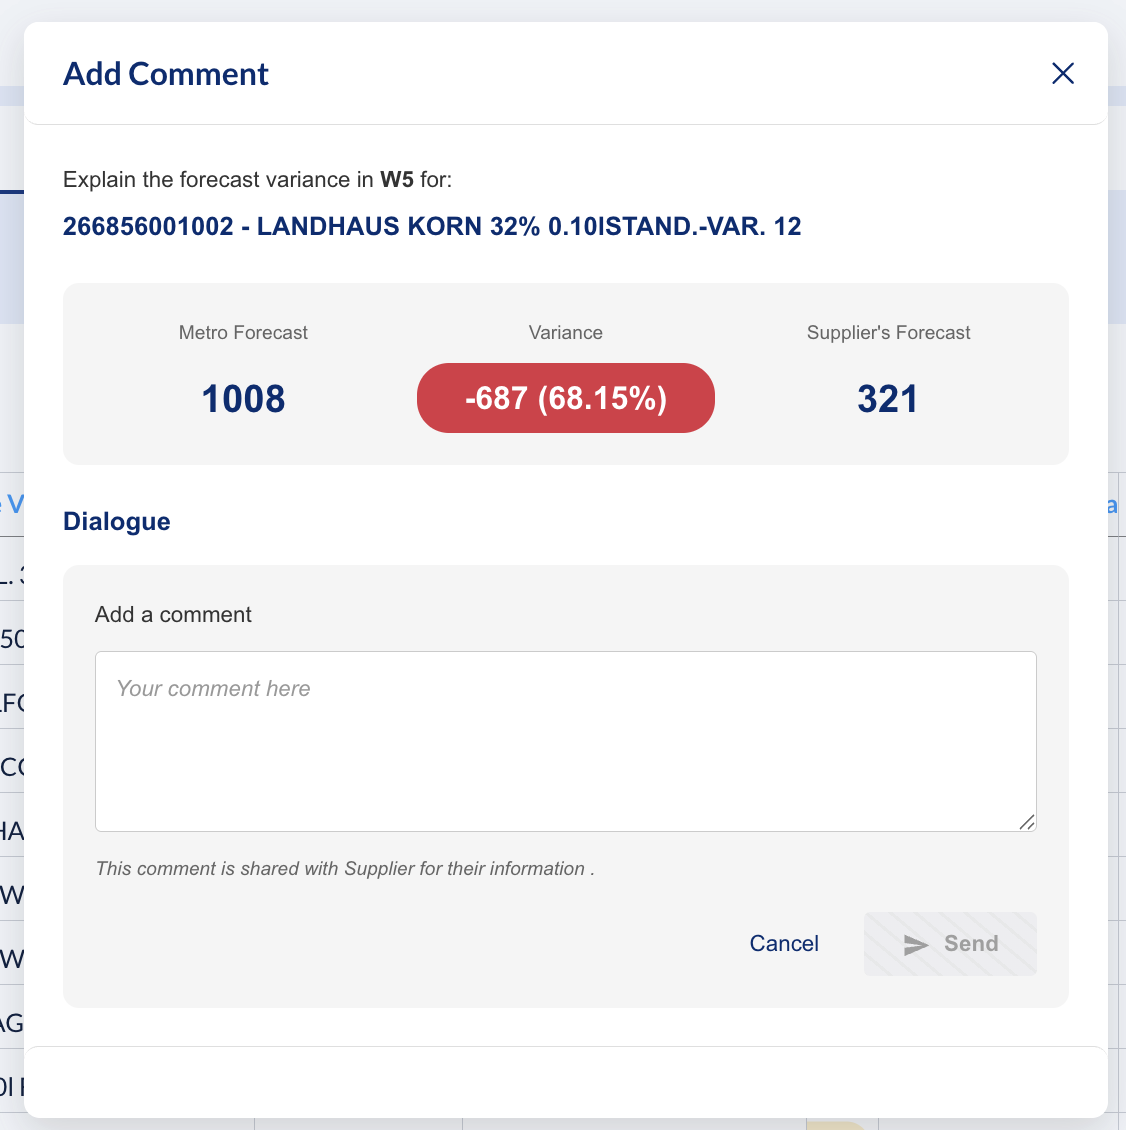
A window pops up, showing you the selected week number and the variance calculated as a quantity and as a percentage.
NOTE: When Supplier Forecast is lower than Metro Forecast, Forecast Variance is reflected as a negative amount.
When Metro Forecast = 0 (zero), variance as a percentage is not reflected in compared data at weekly level.
When Metro Forecast = Supplier forecast, variance of 0 (zero) is reflected in compared data at weekly level. In the grid, the cell for respective week will also have 0 (zero) amount.
Additionally, in the main grid you can check information about Total Absolute Variance and NNBP Variance.
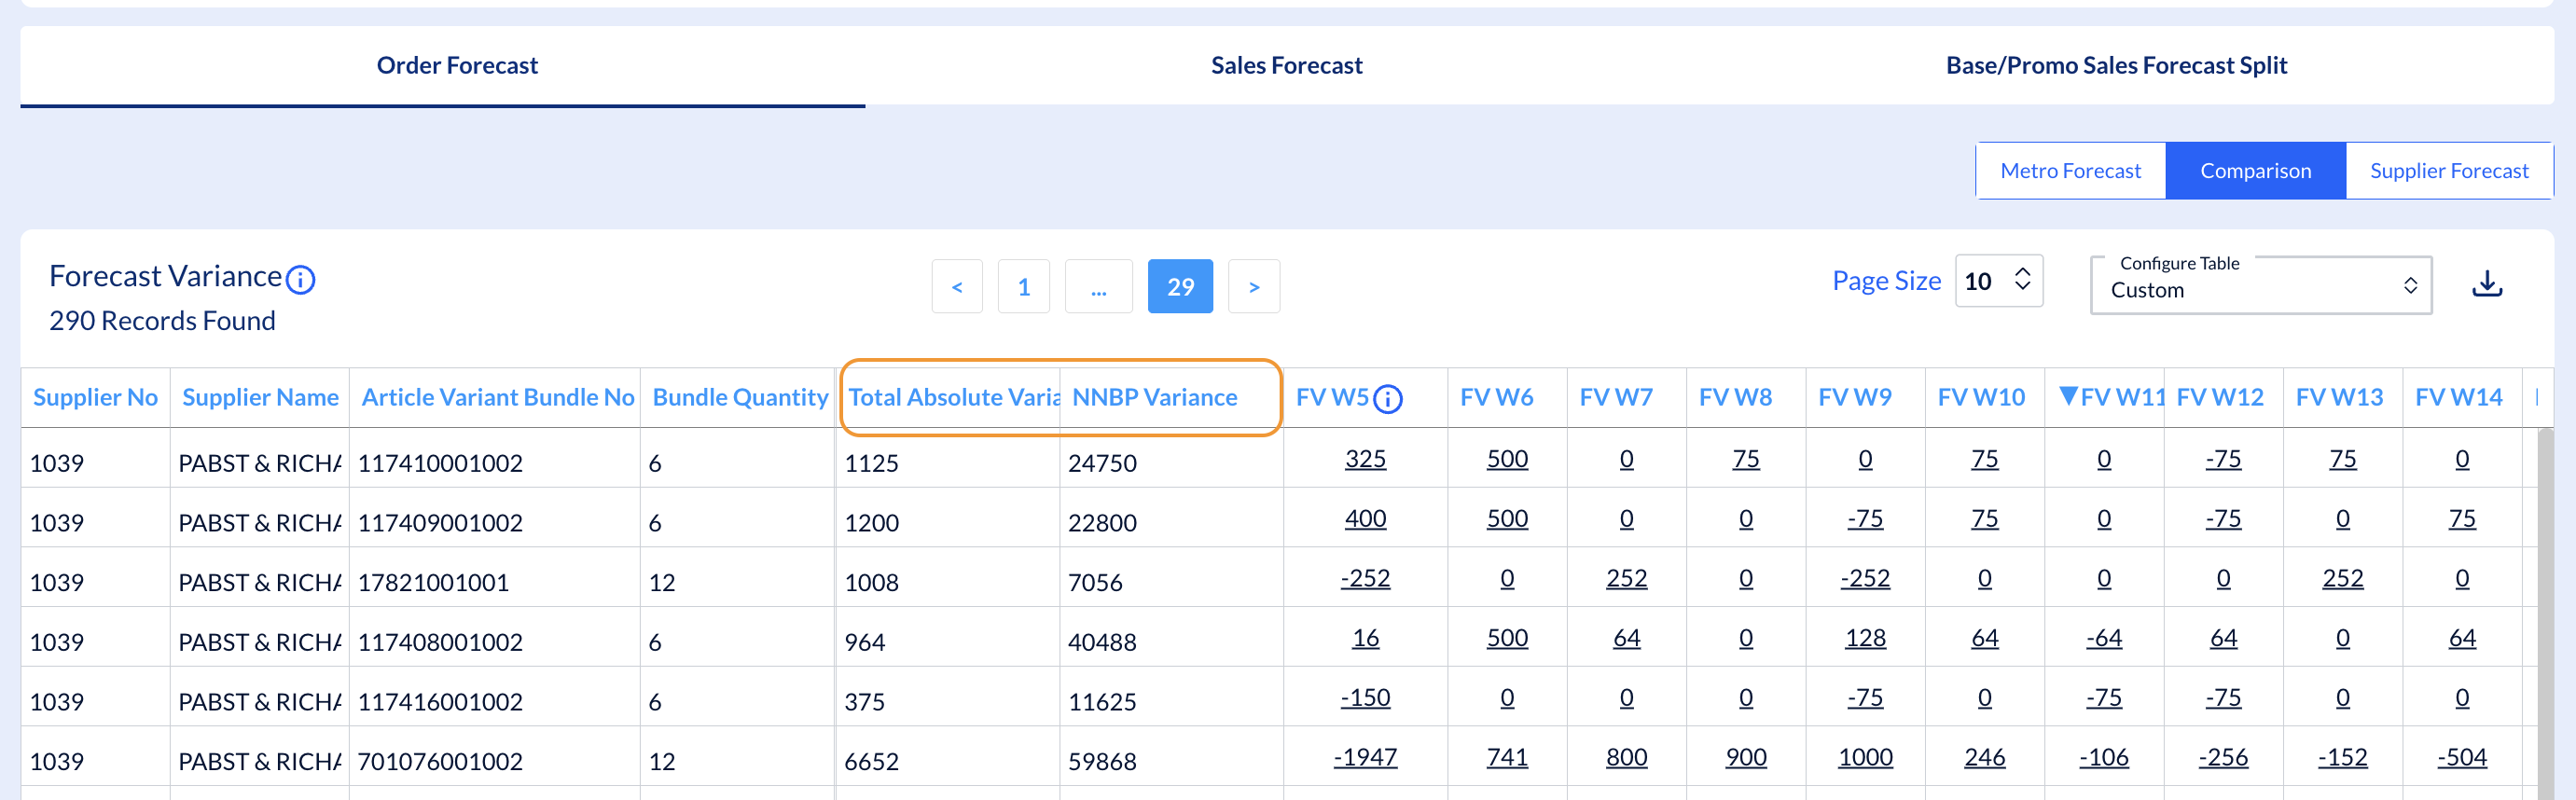
Total Absolute Variance calculates all the differences for entire forecasted period, not considering if the difference in positive or negative. The variance itself (delta between Metro Forecast and Supplier Forecast) will be calculated.
E.g. in the capture above: 325 + 500 + 75 +75 + 75 + 75 = 1125
NNBP Variance reflects the absolute difference, for entire forecast period, expressed in money.
NOTE: The grid from Comparison tab is sorted by NNBP Variance (from the highest amount on top to the smallest one on the bottom).
Comments
The Comparison grid gives you the possibility to communicate with your suppliers by leaving and receiving comments. You have two options to do this:
1. Leave a comment for a particular week, by clicking on that particular week (cell) in the grid. In the pop-up window you can add your comment and send it to the supplier.
Your supplier can answer to you using the same comment option and you will see his comment highlighted with a yellow dot.
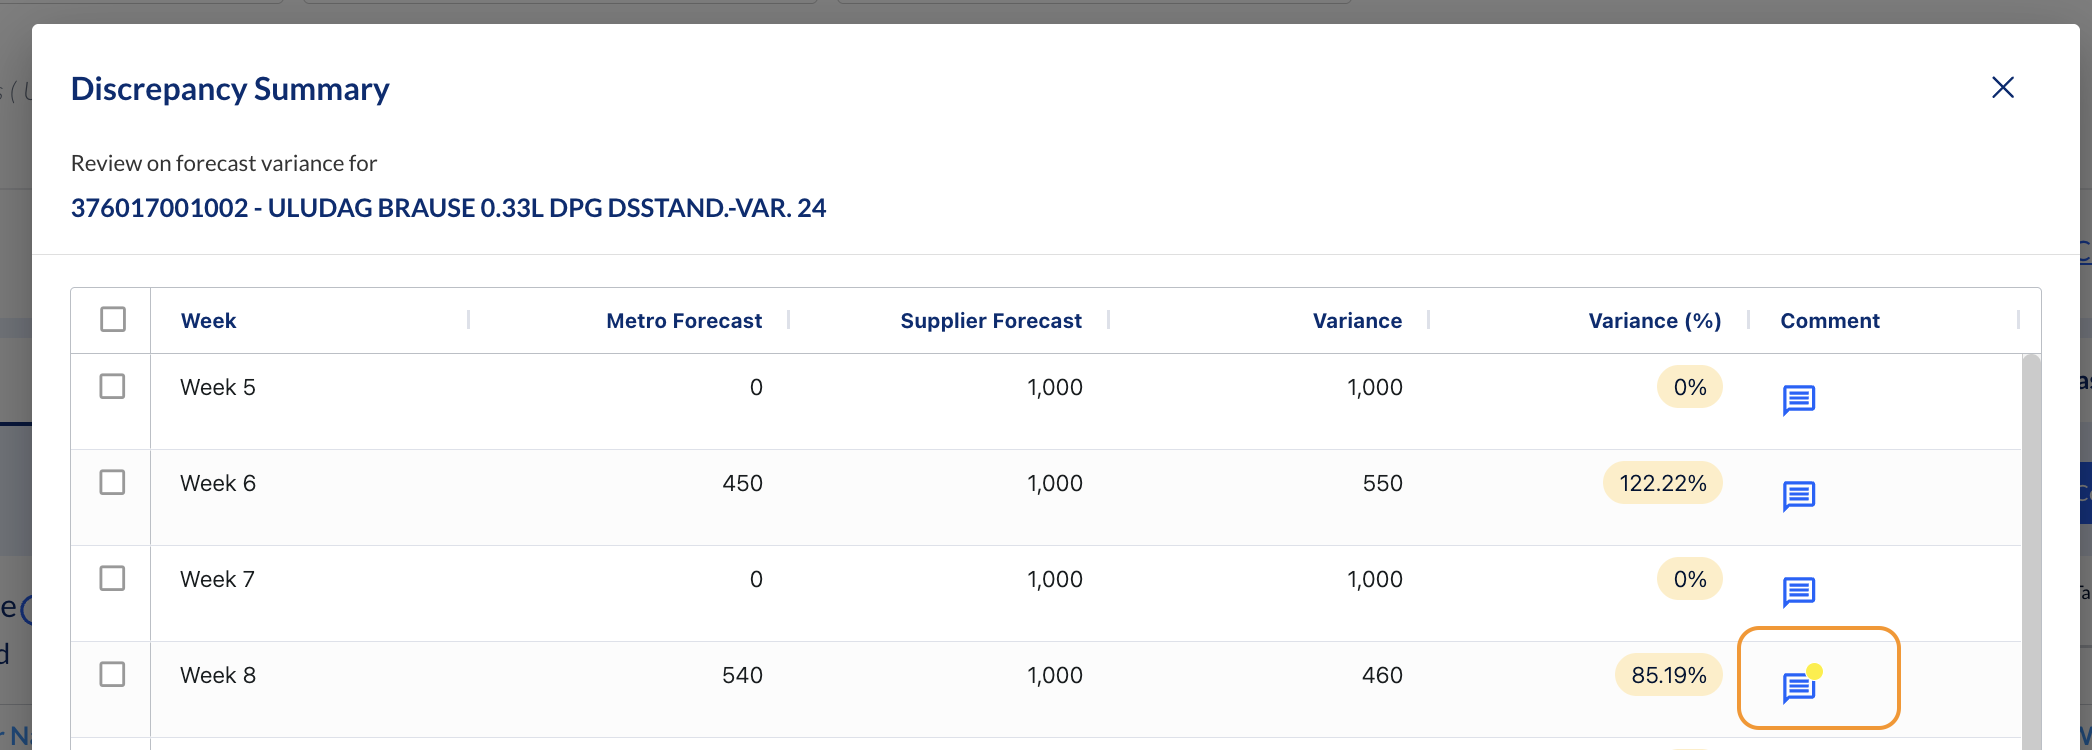
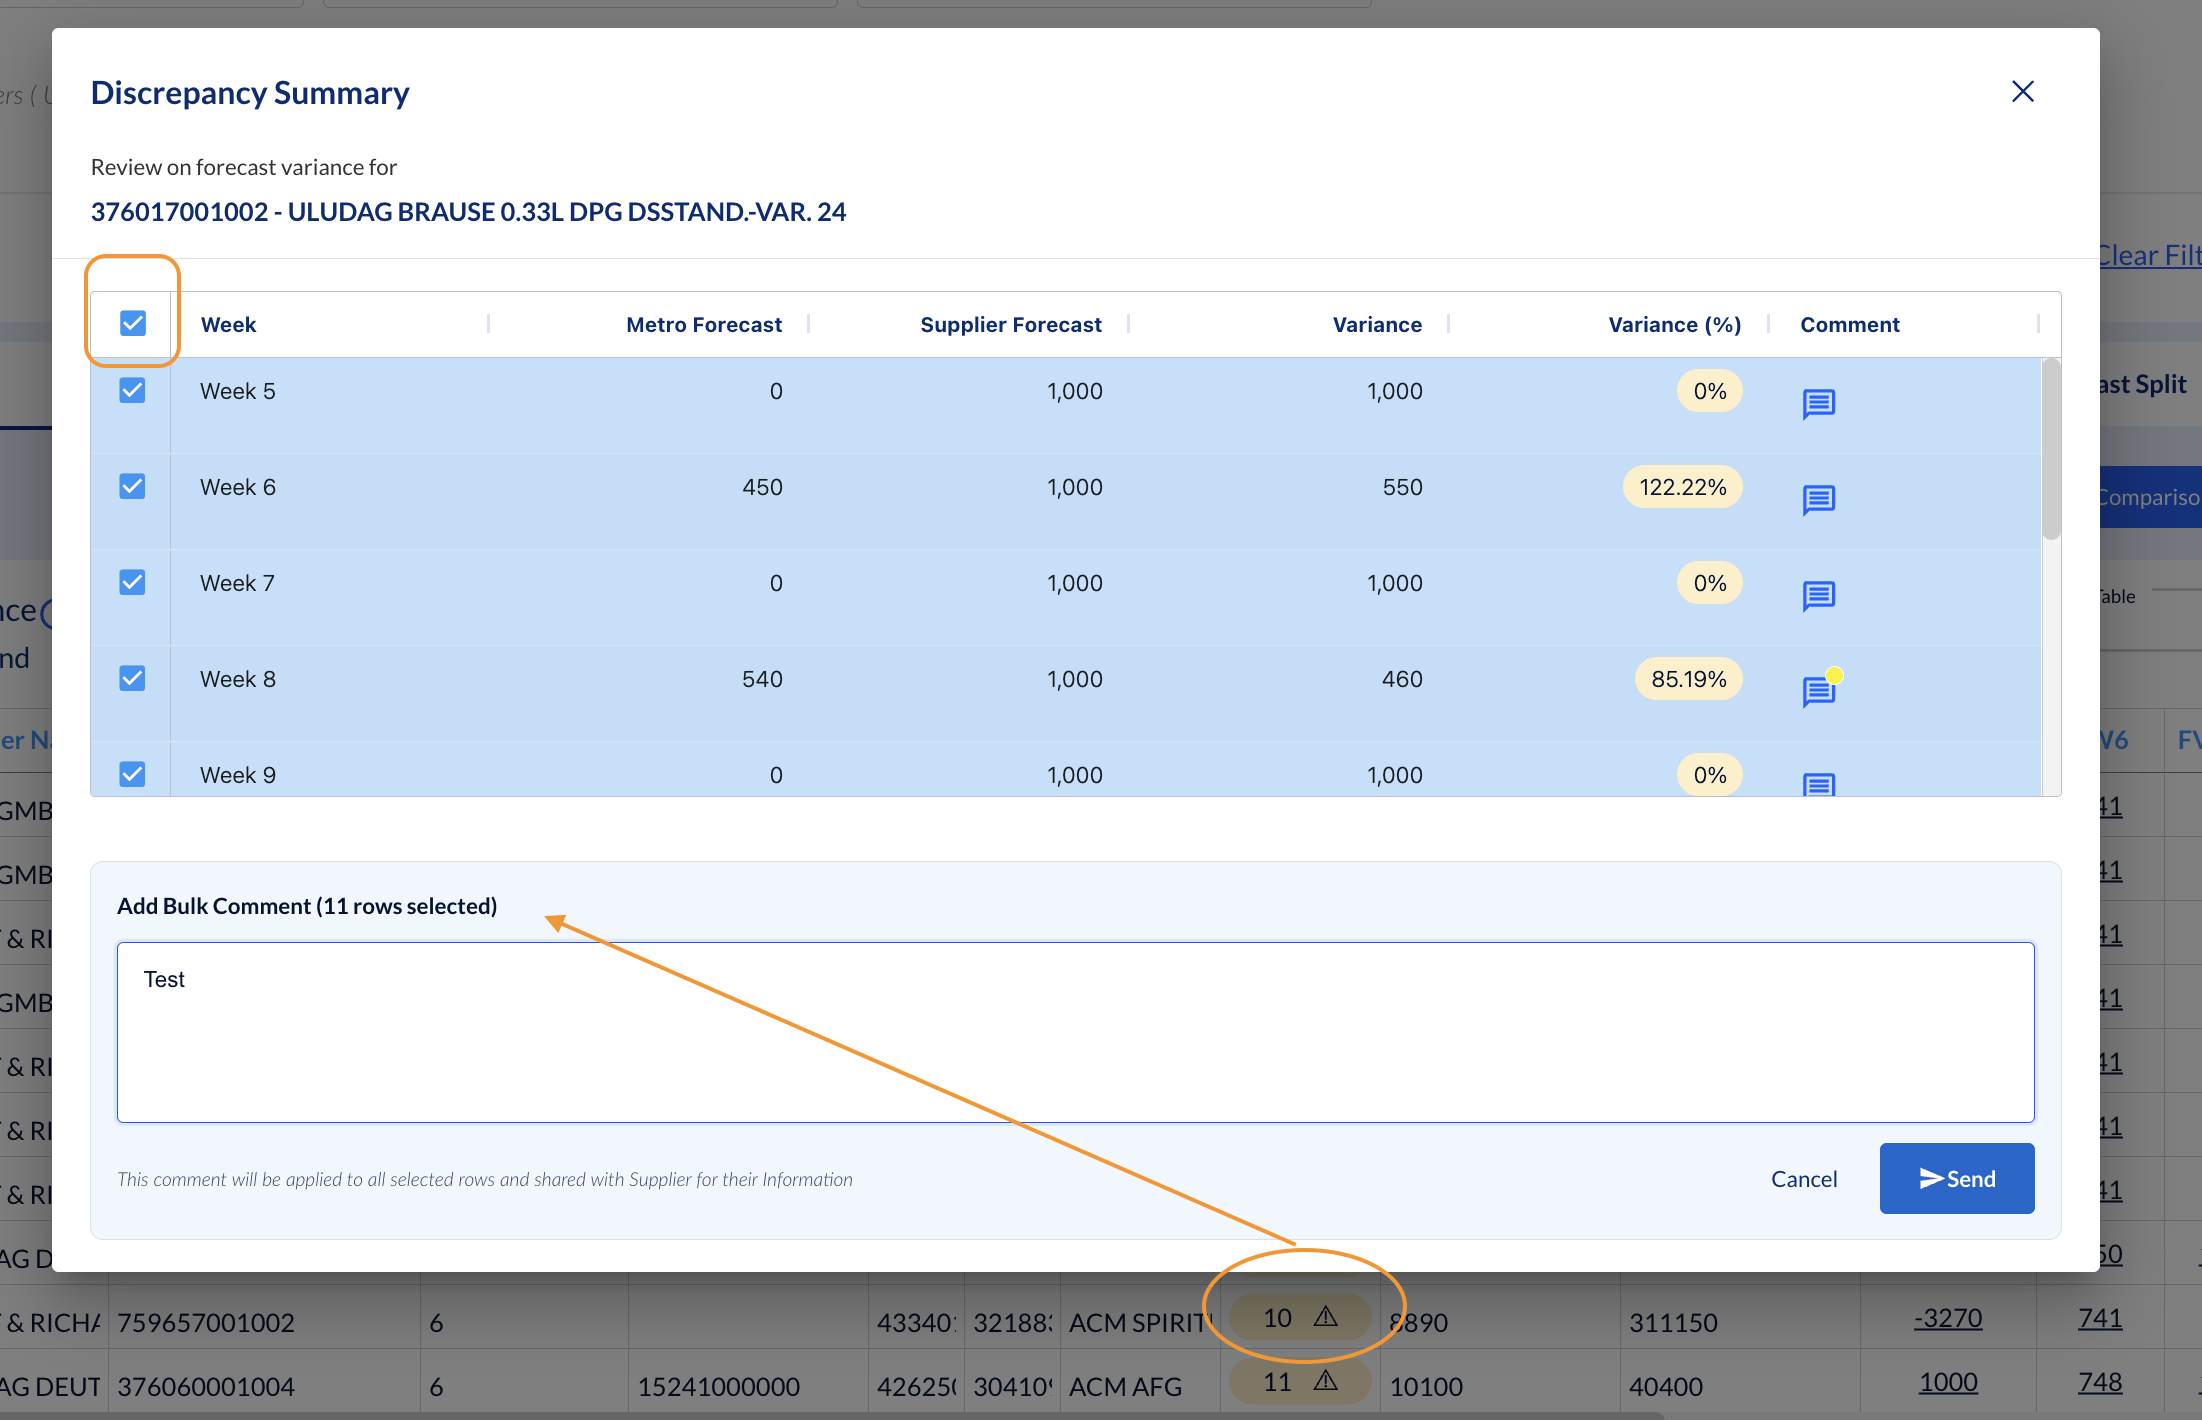
2. Expand the warning cell from Discrepancy column. As mentioned above, all weeks where there are discrepancies between Metro and Supplier Forecasts are shown in the pop-up window. There you can add a comment for a particular week by clicking on the icon in the Comment column or select several weeks and bulk-update them with the same comment.
NOTE: Supplier Forecast and Comparison are disabled (grey) if there is no data uploaded by Suppliers.